Module 3—Electrical Phenomena
 Lesson 2 Lab: Simulating Coulomb’s Experiment
In this lab activity you will simulate what Coulomb did to derive the equation to describe the electrostatic force. This activity will be broken into two parts. The first part of this lab investigates the relationship between the distance of separation (r) on the electrostatic force ![]() , while the second part investigates the relationship between the amount of charge (q1 and q2) and the resulting electrostatic force
, while the second part investigates the relationship between the amount of charge (q1 and q2) and the resulting electrostatic force ![]() .
.
Part A: How the Electrostatic Force is Affected by Distance of Separation (r)
Purpose
In this part of the investigation you will examine how Coulomb gathered data from a torsion balance experiment to determine the relationship between the distance of separation and the electrostatic force. You will be given sample data to graph and analyze to find the relationship.
Materials
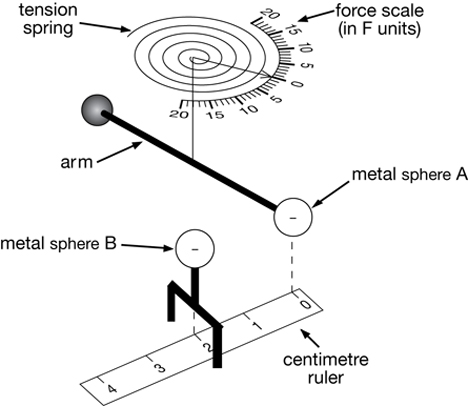
You will need a calculator, a pencil, an eraser, a straight edge or ruler, and a piece of graph paper. If you decide not to use graph paper, you will need a graphing calculator or a computer that has spreadsheet software to do graphing. Below is a diagram of Coulomb’s torsion balance apparatus set up for the experiment.
Variables
Before starting the experiment Coulomb had to identify the manipulated variable and predict what would happen when metal sphere A was released. Study the previous diagram, and answer the Self-Check questions about it.
 Self-Check
SC 7. Identify the type of force that causes the acceleration of sphere A.
SC 8. Determine if the force will push sphere A away from sphere B or toward sphere B. Support your answer.
SC 9. Assume that sphere B is fixed in position and that sphere A is free to rotate. Determine if the arm holding sphere A will rotate clockwise or counterclockwise (if viewed from above as shown in the illustration.)
Self-Check Answers
SC 7. The acceleration is caused by electrostatic force acting on sphere A. According to Newton’s third law, an equal force is acting in the opposite direction on sphere B.
SC 8. The force on sphere A will act to push it away from sphere B since each sphere has a negative charge and like charges repel.
SC 9. Sphere A will rotate counterclockwise since it is repelled from sphere B.
If the arm on the torsion balance rotates, it will cause the torsion spring to tighten with a certain force. This is indicated on the scale. Coulomb had predetermined the graduation of the force scale in grains of force. In this simplified version, the scale is set in units of force that will be referred to as F units.
Procedure
- Sphere B is initially given a negative charge by touching it to a charged rubber rod that was rubbed with fur. Since Coulomb did not have a precise value for the charge on sphere B, he simply referred to this charge as qB.
- Touch Sphere B momentarily to sphere A, which was initially neutral.
- With sphere A held stationary, place sphere B 1.0 cm away. Release sphere A, allowing the arm on the torsion balance to rotate. Measure the force acting on sphere A on the scale at the top of the torsion balance.
- Repeat the preceding step with sphere B set at the following distances from sphere A’s positions: 2.0 cm, 4.0 cm, and 8.0 cm.
- The results of all the trials are indicated in the diagrams shown in the Observations section. Note that the angles of rotation have been made large enough for you to make force measurements. In Coulomb’s actual apparatus, the angles of rotation were all less than 10°.
Self-Check
SC 10. Remember that spheres A and B are identical in size and both are made of metal.
- Describe what happens to the charge when sphere B is touched to sphere A.
- Determine and explain the total charge that is present on both spheres A and B after they touch.
- Determine and explain the charge that would be on each sphere after they were touched and separated.
Self-Check Answers
SC 10.
- Since sphere A and sphere B are conductors, electrons will flow from sphere B to sphere A until the charge on each is the same. This is an example of charging by contact.
- The total charge must be qB, in accordance with the law of conservation of charge.
- Since the original amount of charge qB is shared, the charge on sphere A will be
 and the charge on sphere B will be .
Observations
The following multimedia will show you the results when Coulomb released sphere A from different distances. Click on the “Next” button to see the different force and distance values and fill in the results for Self-Check 11.
Data
Self-Check
SC 11. Study the diagrams, and create a chart of data values showing the distance of separation and the corresponding force for each trial. Remember that you can use a graphing calculator or a spreadsheet instead of a paper chart.
Self-Check Answer
SC 11.
Distance (r) Between the Centres of the Two Charged Objects (cm) |
Electrostatic Force Acting on Sphere A (F units) |
1.0 |
16.0 |
2.0 |
4.0 |
4.0 |
1.0 |
8.0 |
0.3 |
Analysis
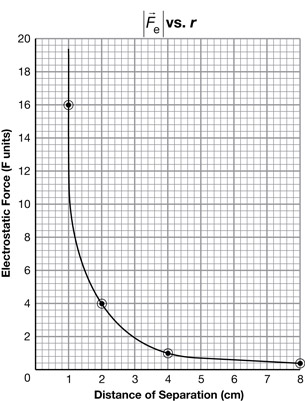
SC 12. Draw a graph of ![]() as a function of r. You can use the following steps as a guide:
as a function of r. You can use the following steps as a guide:
- Explain which variable is the manipulated variable, which variable is the responding variable, and which variables are held constant.
- Label the axis with the manipulated variable on the x-axis and the responding variable on the y-axis.
- Scale the axis and plot the points.
- Draw the line of best fit for this data.
Self-Check Answers
SC 12.
- In this experiment the distance is the manipulated variable since this variable is changed intentionally. The electrostatic force was the responding variable since the force acting on sphere A depended upon the distance value. The variables that were held constant in this experiment include the charge on each of the spheres.
- to d. There are two ways to graph the results. Method 1 uses pencil and graph paper. Method 2 uses a graphing calculator or computer. You are required to complete only one of the two methods.
Method 1: Using Pencil and Paper
You could also use your graphing calculator.
Method 2: Using a Graphing Calculator or a Computer
If you used a graphing calculator or computer software to answer this question, be sure to communicate your answer in the proper format.
Data Entry:
r (cm) entered into L1
F (F units) entered into L2
Window Settings:
x: [0,10, 1]
y: [0,20,1]
Plot Setup:
To plot F (F units) versus r (cm), enter L2 for y and L1 for x.
SC 13. Earlier in this lesson, the suggestion was made that the equation describing the electrostatic force that acts on one charge due to the presence of a second charge could be an inverse square relationship.
- Use adjacent pairs of data points to illustrate that
 varies as
  .
.
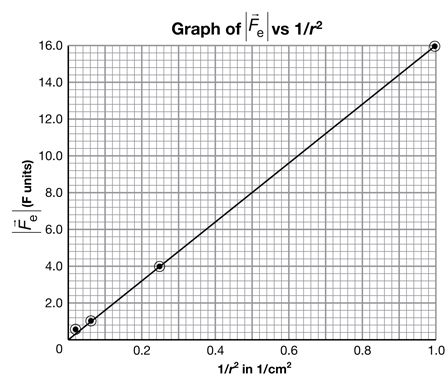
- Instead of sampling individual data points, a better way to demonstrate that Fe varies as is to manipulate the original data chart to produce a straight-line graph. Build a new data chart with columns for the distance (r), the new values that you will be plotting, and the electrostatic force, .
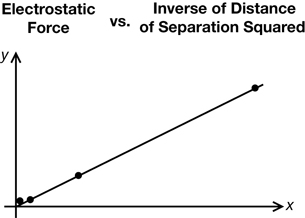
- Use the manipulated data from SC 13. b. to draw a straight line graph illustrating the inverse square relationship.
Self-Check Answers
SC 13.
- An inverse square relationship implies that if one variable increases by a factor of 2, then the other variable decreases by a factor of
 . This is due to the fact that the inverse square of 2 is
  or . This pattern is clearly shown between adjacent pairs of data points. For example, when the distance doubles from 1 cm to 2 cm, the value of the force is reduced from 16 F units to 4 F units, or by a factor of .
- and c. can be done two different ways. Method 1 uses pencil and paper. Method 2 uses a graphing calculator or computer. Both methods use curve straightening to change a curved graph into a straight line graph as you saw in Physics 20. You are required to complete only one of the two methods.
Method 1: Using Pencil and Paper
Distance (r) (cm) |
(F units) |
|
|---|---|---|
1.0 |
1.0 |
16.0 |
2.0 |
0.25 |
4.0 |
4.0 |
0.063 |
1.0 |
8.0 |
0.016 |
0.3 |
You could also use your graphing calculator.
Method 2: Using a Graphing Calculator or a Computer
Although the data chart will look the same, the use of technology allows a very efficient approach. Instead of completing four individual calculations to determine values for ![]() , simply define a third list in terms of the inverse square of all the values for r in L1.
, simply define a third list in terms of the inverse square of all the values for r in L1.
Data Entry:
r (cm) entered into L1
F (F units) entered into L2
![]() , determined by defining L3 as follows: “L3 = (1/L1)2”
, determined by defining L3 as follows: “L3 = (1/L1)2”
- You could calculate the answer using paper and pencil.
If you used a graphing calculator or computer software to answer this question, be sure to communicate your answer in the proper format.
Data Entry:
r (cm) entered into L1
F (F units) entered into L2
![]() entered into L3: “L3 = (1/L1)2”
entered into L3: “L3 = (1/L1)2”
Window Settings:
x: [0,1, 0.1]
y: [0,20,1]
Plot Setup:
To plot F (F units) versus ![]() , enter L2 for y and L3 for x.
, enter L2 for y and L3 for x.
Part A Conclusion
Now that you have seen Coulomb’s observations and learned how to change the curved electrostatic force vs. distance of separation graph into a straight line graph you should have an understanding of how the two variables relate.
SC 14. Based upon your results for SC 13, write a mathematical expression describing the relationship between
Self-Check Answer
SC 14.
The electrostatic force ![]() is inversely proportional to the square of the distance (r2). Mathematically, this is written as
is inversely proportional to the square of the distance (r2). Mathematically, this is written as ![]() .
.